
Drawdown Reports
Drawdown reports in Tradervue focus on periods of drawdown that have ended. Only periods that have recovered to at least $0 are included in these reports.
Please Note: Availability of these stats and reports depends on your subscription level.
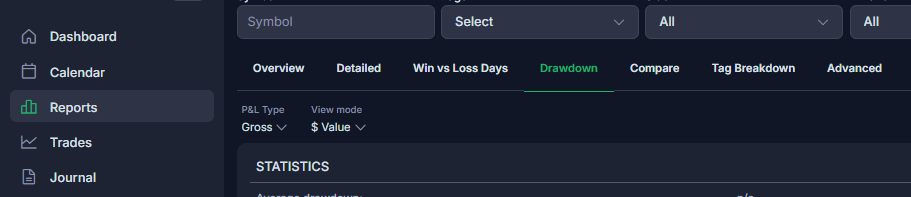
You can find these metrics in the Reports section of the left menu, under the Drawdown tab.
- Average Drawdown:
Displays the average drawdown incurred during all completed drawdown periods in the filtered view.
- Average Number of Days in Drawdown:
Shows the average number of days for all completed drawdown periods within the filtered view.
- Biggest Drawdown:
Indicates the largest drawdown experienced during all completed drawdown periods in the filtered view.
- Number of Days in Drawdown:
Total number of days containing trades across all completed drawdown periods in the filtered view.
- Average Trades in Drawdown:
The average number of trades taken during all completed drawdown periods in the filtered view.
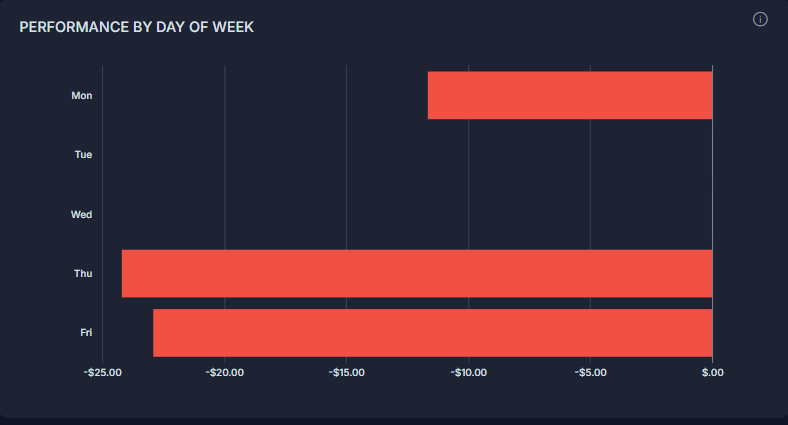
Performance by Day of Week:
Summarizes drawdown period increases, grouped by the entry day of the week. This figure will always be negative.
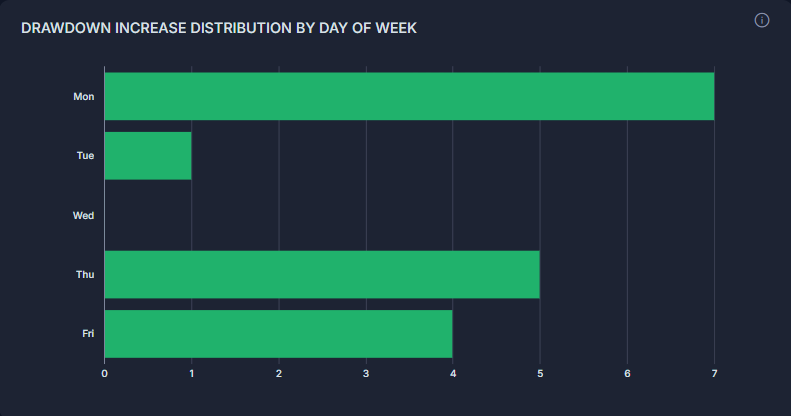
Drawdown Increase Distribution by Day of Week:
Provides a distribution chart showing the days of the week when drawdowns increased during the current filter.
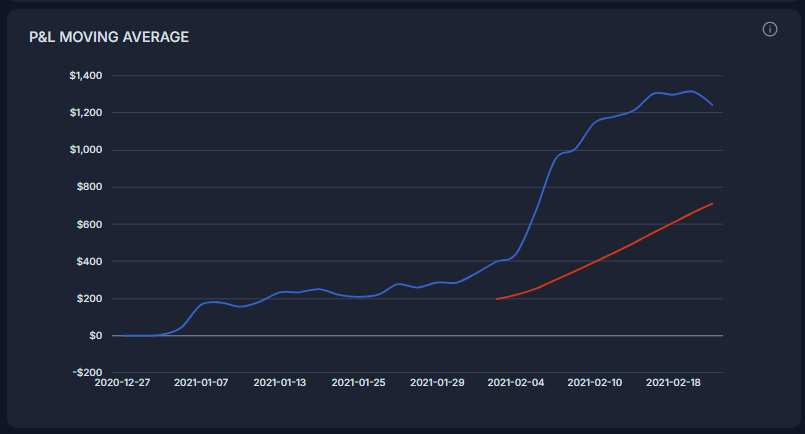
P&L Moving Average:
Displays a P&L chart for all days matching the current filter, overlaid with a moving average (Simple or Exponential). You can select the period and type in the Drawdown Settings.
P&L Volatility:
Shows a P&L chart for all days matching the current filter, overlaid with up to two Bollinger Bands. The factor can be chosen in the Drawdown Settings.

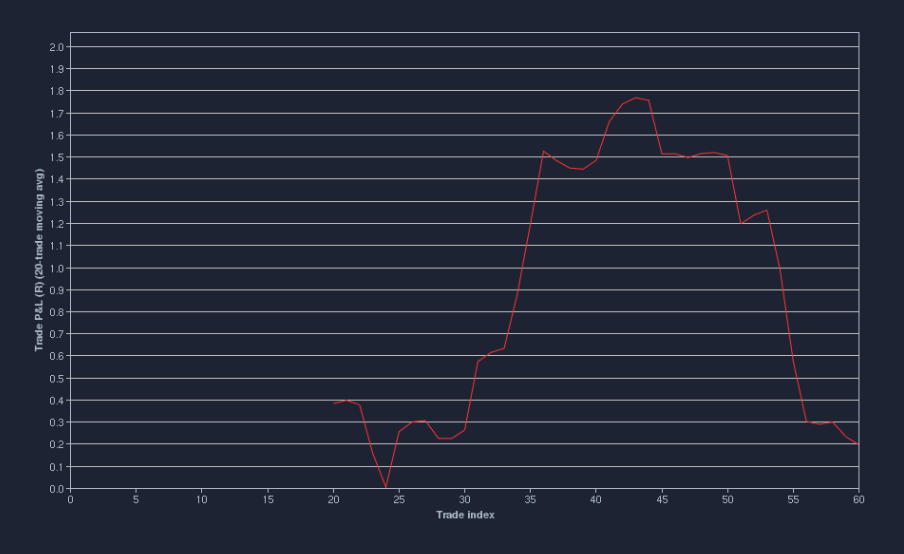
Average P&L (R) Expectancy (over 20 trades):
Helps monitor the consistency of recent trading results. A trend above the 0 line indicates healthy recent trading performance.
Need Help?
If you have questions or encounter issues importing data, please reach out to support@tradervue.com or use the "Contact Us" link below.