
TR/ATR Report
The TR/ATR Report provides a clear view of the recent volatility in a trading instrument. This is measured using the instrument's True Range (TR) for the trading day, divided by the Average True Range (ATR) over the past 14 days. The result is expressed as a percentage, showing how much more or less the instrument moved compared to its recent average.
Key Points:
- TR (True Range): Represents the instrument’s actual price movement for the trading day.
- ATR (Average True Range): The 14-day average of the daily True Range, which reflects the instrument’s volatility over time.
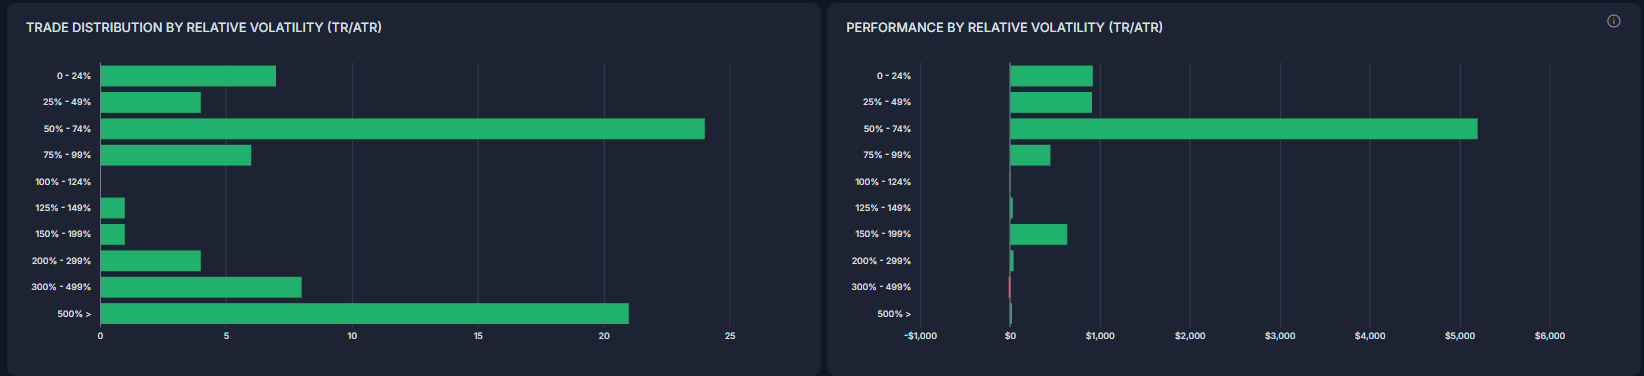
This report offers insight into how today’s price movement compares to its recent volatility. A higher percentage indicates that the instrument moved more than its 14-day average range (ATR), making it more volatile than usual.
Performance Impact:
In the example provided, the trader’s P&L performance was significantly better on days when the instrument's TR exceeded the ATR. On days when the instrument moved less than its ATR, performance was weaker, highlighting the importance of trading in high-volatility environments.
Accessing the Report:
The TR/ATR Report is available to all Silver and Gold users in the following tabs:
- Reports section → Detailed tab → Instrument group.
- Win vs Loss Days tab.
- Reports section→ Compare tab.
This report is a valuable tool for understanding the relationship between volatility and trading performance, helping traders optimize their strategies.
Need Help?
If you have questions or encounter issues importing data, please reach out to support@tradervue.com or use the "Contact Us" link below.