
Chart Studies and Comparative Analysis
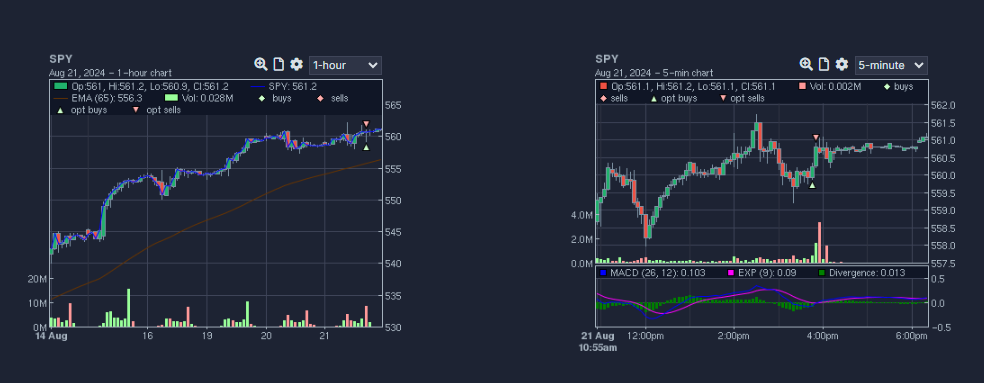
Tradervue supports adding studies and comparison symbols to auto-generated price charts for Silver and Gold subscribers. This feature allows you to include technical studies such as moving averages (e.g., EMA(20)) on your charts, so you can review them later in your journal.
Here are a few examples of the new studies in action:
Adding Studies to Your Charts
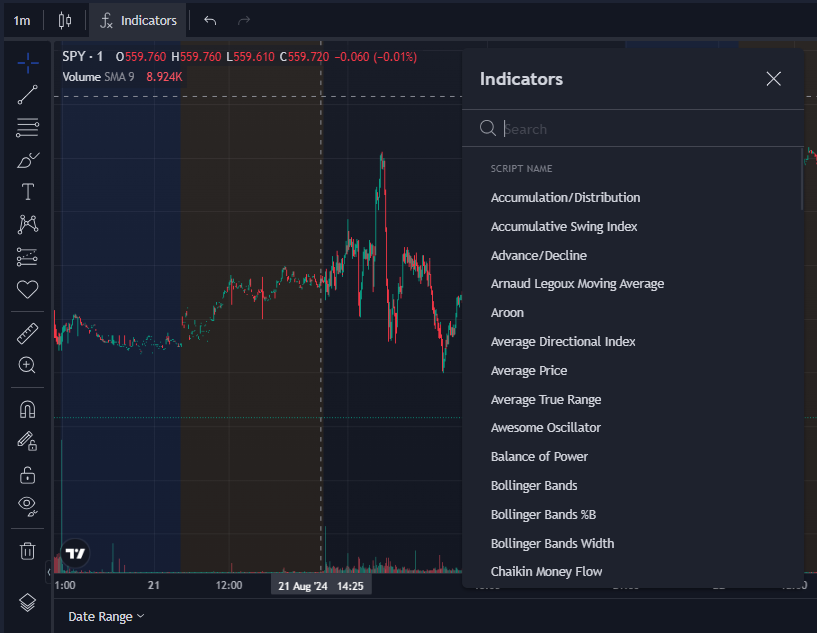
Access Study Editor:
- Click the study icon located above each chart (next to the zoom icon) to open the study editor for that chart.
- In the study editor, you can select studies and adjust their parameters according to your preferences.
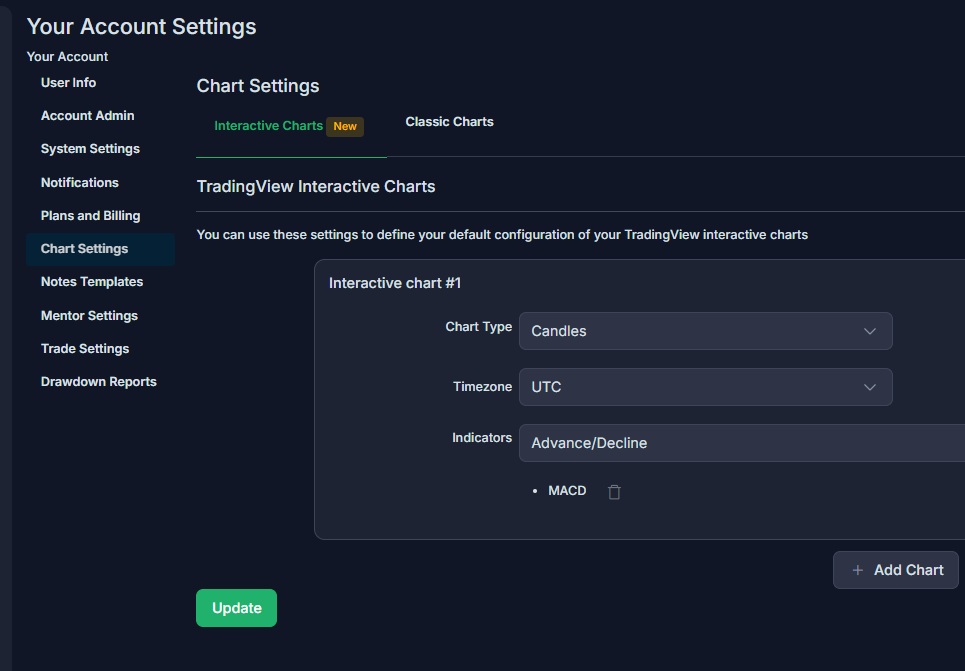
Set Up Chart Defaults:
- You can configure your default chart settings so that all of your trades start with the same set of studies. To set up your execution charts in this manner, follow these steps:
- Log in to your Tradervue account.
- Click on the Settings menu next to your username in the lower-left corner of the dashboard.
- Click on the Chart Settings tab on the left side.
- Specify Default Charts: You can configure up to four charts for each trade page by specifying the default settings you want for each chart.
With these options, you can customize and standardize your charting setup, making it easier to analyze your trades and review your performance.
Need Help?
If you have questions or encounter issues importing data, please reach out to support@tradervue.com or use the "Contact Us" link below.