
Reports Based on Trading Instrument Behavior
Tradervue now offers 8 new reports (16 if you include the distribution charts) for analyzing your performance based on the behavior of the stocks or futures you trade. These reports are especially useful for equity traders who base their trades on news or order flow.
To access these reports:
- Go to the Detailed Reports tab (also available in the Win vs. Loss Days and Compare tabs).
- Look for the new reports group called Instrument. Click on it to see the updated reports. You’ll find the old performance by symbol reports at the top, and below them, the new reports.

Here’s a breakdown of the new reports:
Reports Based on Instrument Volume:
-
Distribution/Performance by Instrument Volume:
Shows your performance plotted against the total volume traded on the day.

-
Distribution/Performance by Instrument Relative Volume:
Displays your performance plotted against the relative volume traded on the day, compared to the 50-day moving average of volume. This helps you understand your performance on days with unusually high or low volume.

-
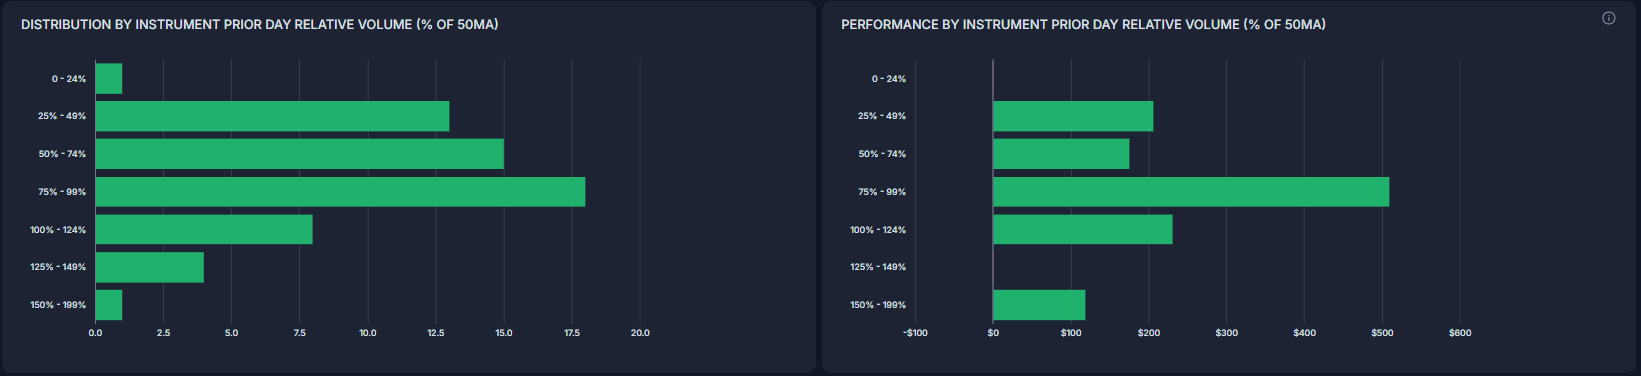
Distribution/Performance by Instrument Prior Day Relative Volume:
Shows your performance plotted against the relative volume traded on the day before the trade. This helps assess performance on follow-through days based on the previous day’s volume relative to its 50-day moving average.
Reports Based on the Movement of the Stock on the Day:
-
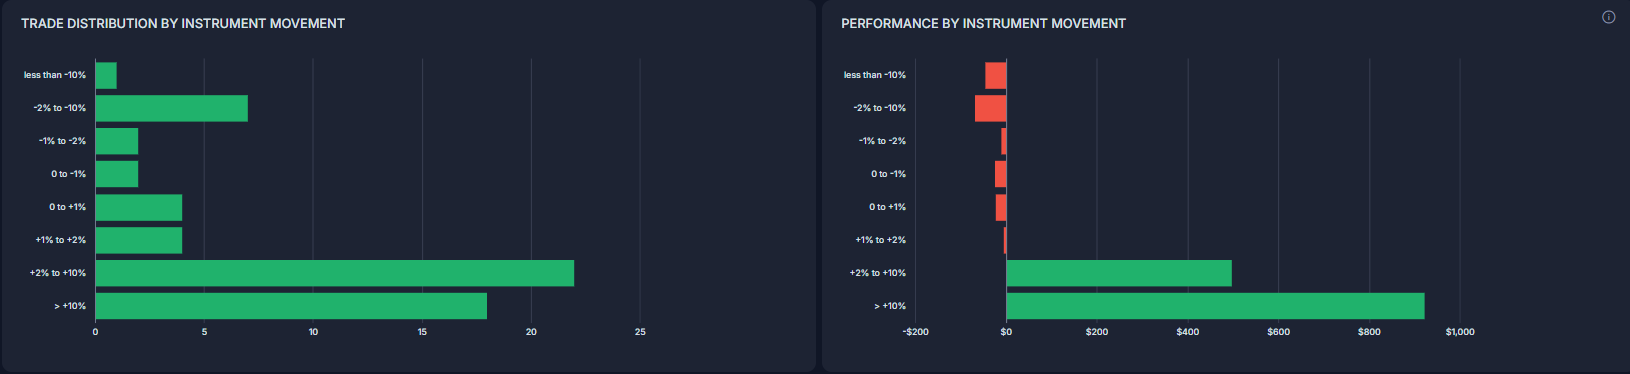
Distribution/Performance by Instrument Movement:
Shows your performance against the total move of the instrument on the day.
-
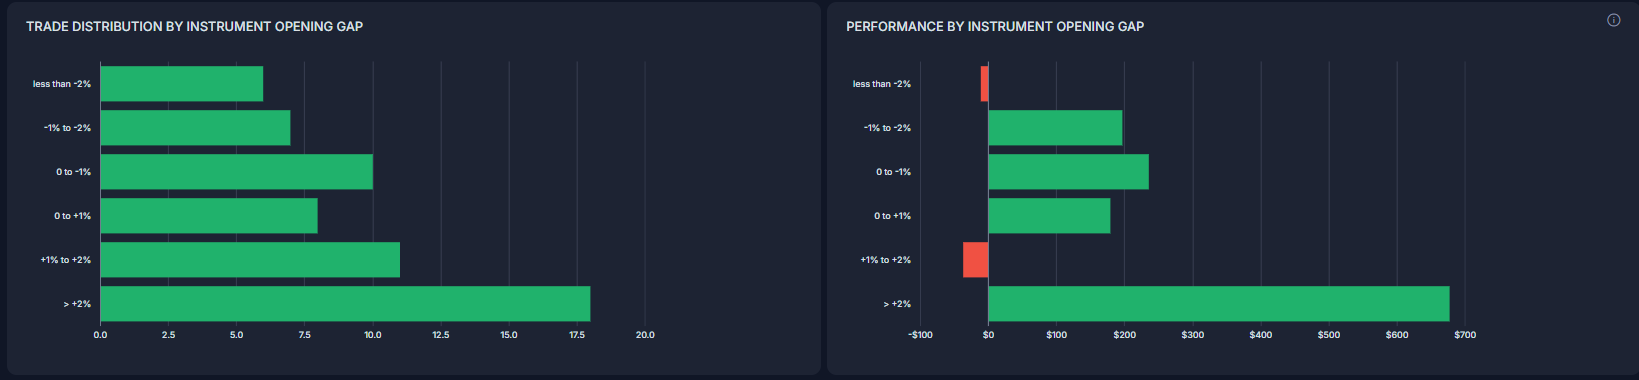
Distribution/Performance by Instrument Opening Gap:
Displays your performance against the opening gap of the instrument on the day. This is useful for traders who focus on large opening gaps due to news.
-
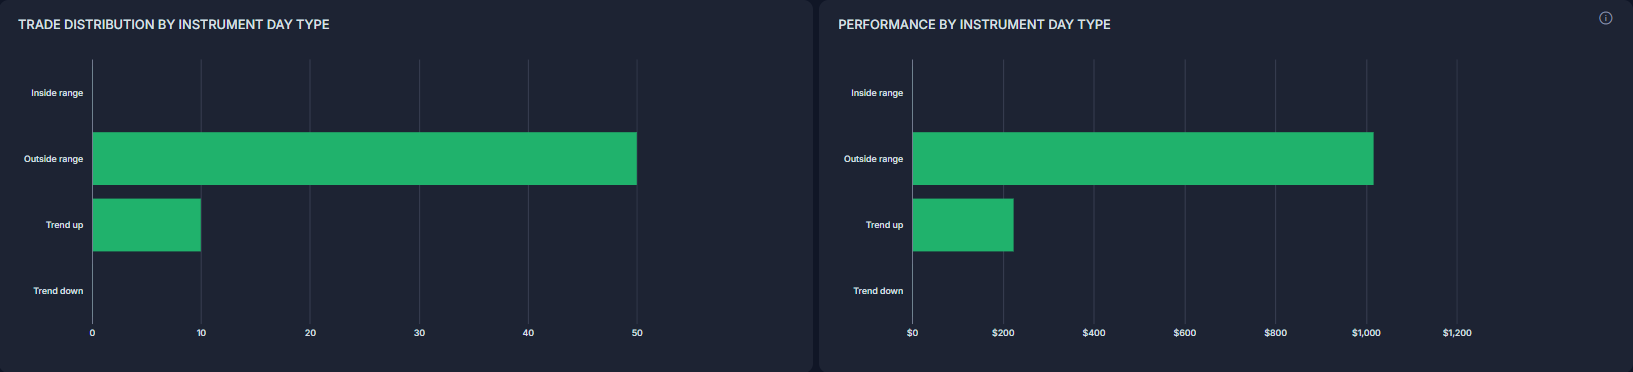
Distribution/Performance by Instrument Day Type:
Shows your performance plotted against the day type of the instrument you’re trading. This helps you understand if you’re successfully capturing moves on trending days.

Reports Based on Average True Range (ATR):
-
Distribution/Performance by Instrument Movement (ATR):
Shows your performance against the total move of the instrument on the day, considering the ATR.
-
Distribution/Performance by Instrument Opening Gap (ATR):
Displays your performance against the opening gap of the instrument on the day, with ATR considered. This insight is useful for evaluating trading strategies based on news-induced gaps.
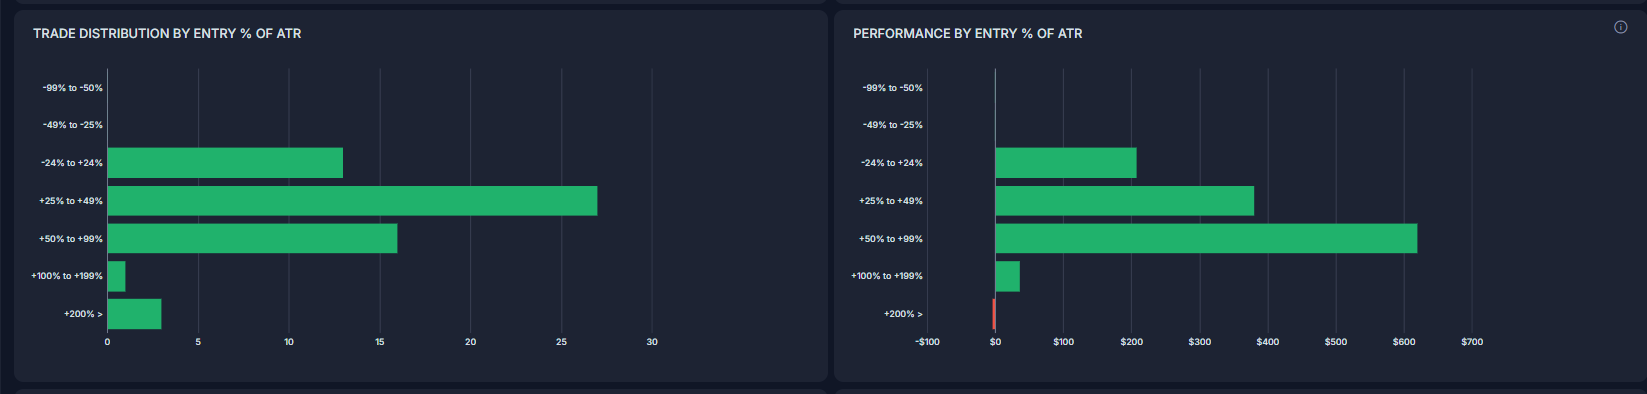
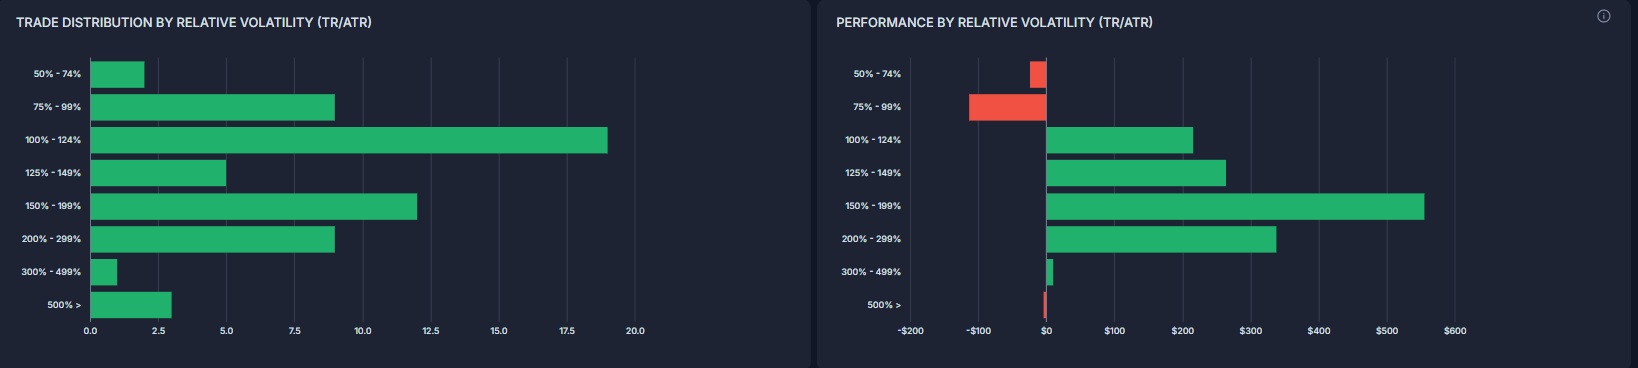
-
Trade Distribution and Performance by Relative Volatility (TR/ATR):
Shows your performance plotted against the relative volatility of the instrument, measured as the trading range (TR) relative to the ATR. This report helps assess how your performance correlates with changes in volatility and provides a distribution of your performance based on this relative volatility
Advanced Reports Statistics:In addition to the above reports, the following statistics are now available in the Advanced reports for plotting on either axis:
- Instrument Volume: Total volume traded.
- Instrument Volume (% of 50-Day MA): Volume as a percentage of the 50-day moving average.
- Instrument Prior-Day Volume (% of 50-Day MA): Previous day’s volume as a percentage of the 50-day moving average.
- Instrument Movement (%): The percentage movement of the instrument on the day.
- Instrument Opening Gap (%): Percentage of the opening gap of the instrument.
- Instrument ATR (14): Average True Range over 14 days.
- Entry as % of ATR (14): Entry price as a percentage of the ATR (14).
Reports Based on Entry Price vs. 50-Day SMA:
-
Trade Distribution by Entry Price vs. 50-Day SMA:
Displays a chart showing the distribution of trade entries relative to the 50-day Simple Moving Average (SMA) of the instrument. The SMA range can be adjusted from 5 days to 200 days to fit different analysis needs.
-
Performance by Entry Price vs. 50-Day SMA:
Shows your performance plotted against the entry price relative to the 50-day SMA. You can adjust the SMA range from 5 days to 200 days to better understand how your performance is influenced by the price level relative to the SMA.
For detailed analysis and to access these reports, ensure you have the appropriate subscription level and filters applied.
Need Help?
If you have questions or encounter issues importing data, please reach out to support@tradervue.com or use the "Contact Us" link below.