
Liquidity Reports
Tradervue offers detailed analytics for adding and removing liquidity, which is especially useful for active traders. These reports help you understand your performance based on liquidity dynamics.
To access Liquidity Reports:
- Go to the Reports section.
- Select either the Detailed, Win vs. Loss Days, or Compare tab.
- Click on Liquidity in the report detail selector.

Liquidity Breakdown:
-
Performance by All Shares Adding Liquidity:
This report shows your distribution and aggregate or average P&L performance, grouped by the percentage of shares in the trade that added liquidity. For example, 0% means you took liquidity on all executions, and 100% means you added liquidity on all executions.

-
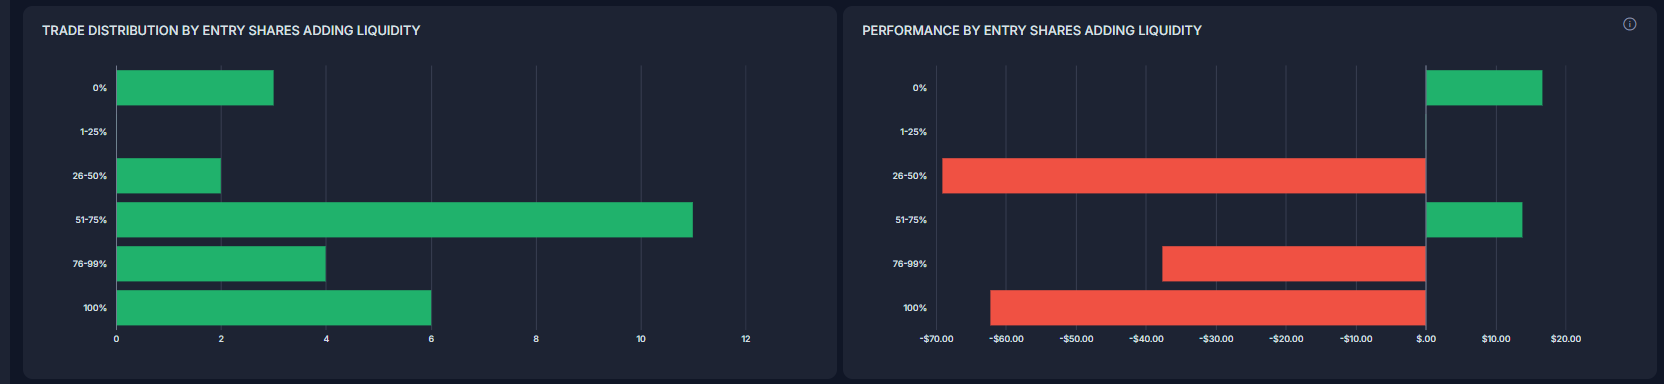
Performance by Entry Shares Adding Liquidity:
This report displays your performance based on how many entry shares (shares bought or initiated) added liquidity. "Entry Shares" refers to all shares on the same side as the opening execution (e.g., all buys for a long trade).
-
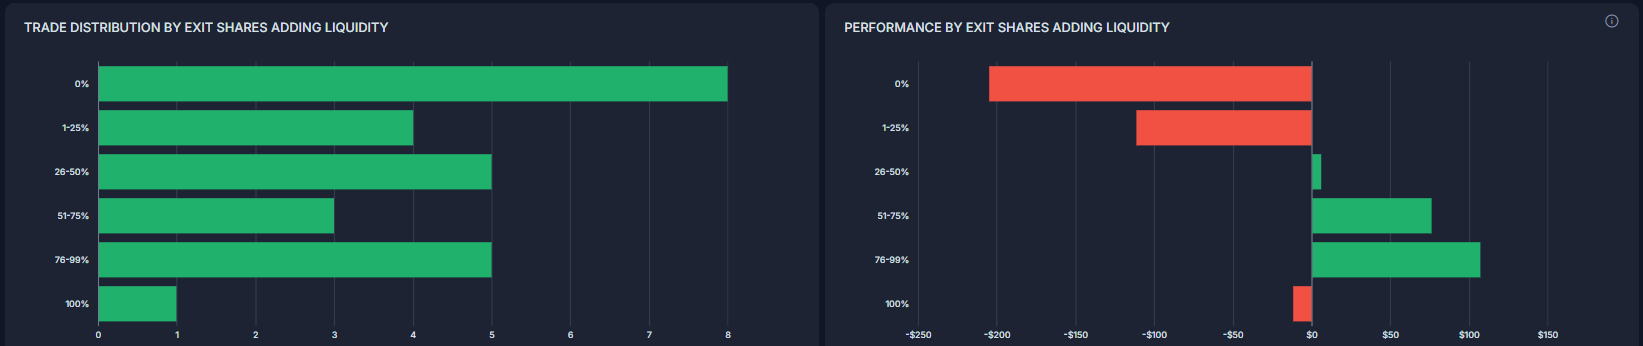
Performance by Exit Shares Adding Liquidity:
This report shows your performance based on how many exit shares (shares sold) added liquidity. "Exit Shares" are all shares on the opposite side from the opening execution (e.g., all sells for a long trade).
Liquidity Visualization:
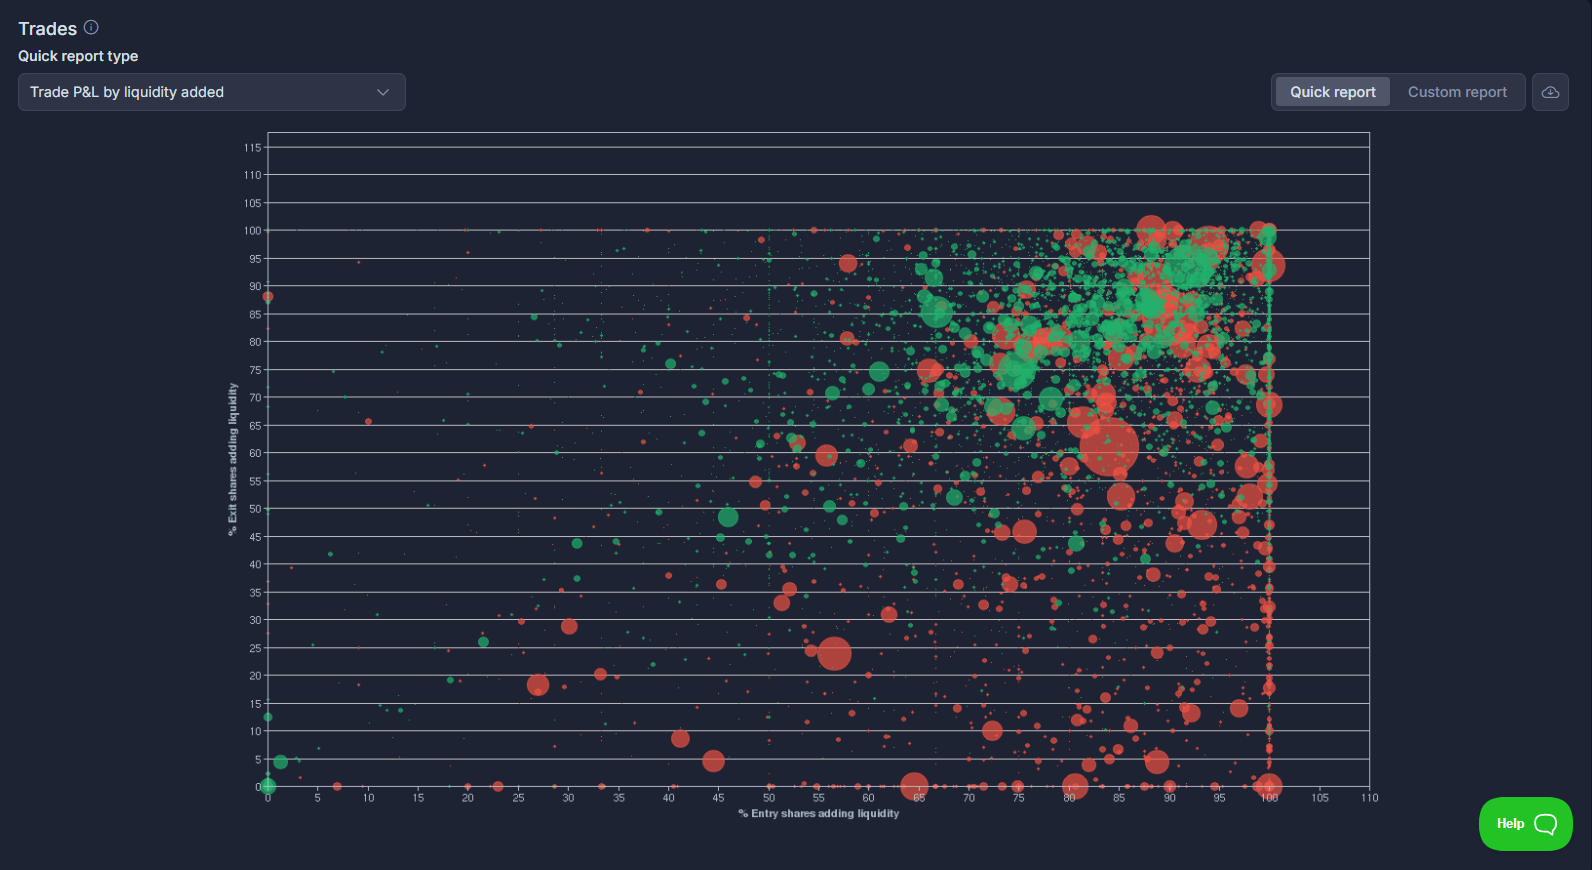
Trade P&L by Liquidity Added:
Available on the Advanced tab of reports, this visualization plots trades based on the percentage of entry and exit shares that added liquidity. The X-axis represents the percentage of entry shares where liquidity was added, and the Y-axis represents the percentage of exit shares where liquidity was added.
- Green Circles: Represent trades with positive P&L.
- Red Circles: Represent trades with negative P&L.
- Circle Size: Indicates the relative amount of P&L, with larger circles showing the biggest winners and losers.
Requirements:
- Broker or Platform Data: Your broker or trading platform must include the necessary data for calculating liquidity. Tradervue interprets ECN fees to determine liquidity.
Refer to our supported brokers/platforms chart to check compatibility.
- Subscription Level: Liquidity reports require a Gold subscription to Tradervue.
Note: Tradervue assumes you execute at an ECN that charges a fee for removing liquidity and provides a rebate for adding liquidity. If you trade at venues with different fee structures, the liquidity reports may not be accurate.
Need Help?
If you have questions or encounter issues importing data, please reach out to support@tradervue.com or use the "Contact Us" link below.