
Calendar P&L
The Calendar P&L feature in Tradervue allows you to view your total gains and losses per day.
Follow these steps to access and use this feature:
- Log in to your Tradervue account.
- Go to the Calendar section:
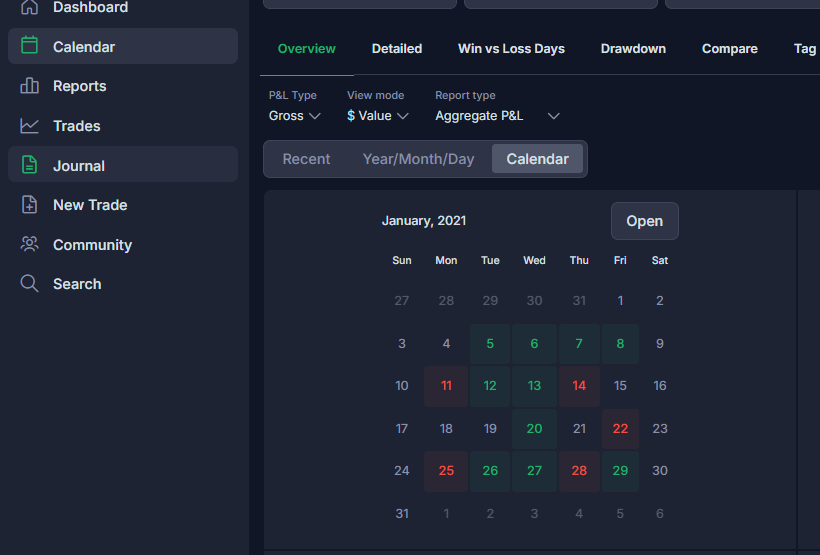
- From the left menu, select "Calendar".
- Alternatively, go to the Reports section, select the Overview tab, and choose ''Calendar''.
- View the Calendar:
- Select a year to see the calendar for that entire year.
- Days will be color-coded: green for positive days, red for negative, blue for flat, and gray for days with no trades.
- Detailed View:
- Click on a month to see detailed information for that month. Each day will display the number of trades and the P&L (aggregate or average, reported in $, ticks, or R, depending on your settings).
- Review Individual Days:
- Click on a specific day to view that day’s page in the Journal View, where you can review the individual trades.
Analyzing Patterns
This feature helps identify patterns at a glance. For example, you might quickly spot that every Thursday and Friday in a given month were losing days. You can then use the detailed reports to explore and understand these patterns.
Need Help?
If you have questions or encounter issues importing data, please reach out to support@tradervue.com or use the "Contact Us" link below.